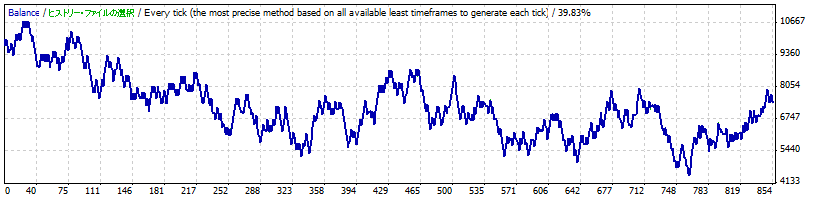
Strategy Tester Report
Sample_break_r
Demo (Build 225)
| 通貨ペア | USDJPY (US Dollar vs Japanese Yen) | ||||
| 期間 | 5分足(M5) 2009.03.20 21:30 - 2009.08.28 12:05 | ||||
| モデル | Every tick (the most precise method based on all available least timeframes) | ||||
| パラメーター | Lots=1; StopLoss=25; TakeProfit=25; Slippage=3; MagicNumber=20090828; MAperiod=100; HighLowperiod=5; | ||||
| Bars in test | 32804 | Ticks modelled | 1454894 | Modelling quality | 39.83% |
| Mismatched charts errors | 1 | ||||
| Initial deposit | 10000.00 | ||||
| Total net profit | -2581.79 | Gross profit | 91895.63 | Gross loss | -94477.42 |
| Profit factor | 0.97 | Expected payoff | -3.03 | ||
| Absolute drawdown | 5645.34 | Maximal drawdown | 6593.31 (60.22%) | Relative drawdown | 60.22% (6593.31) |
| Total trades | 853 | Short positions (won %) | 451 (50.11%) | Long positions (won %) | 402 (45.27%) |
| Profit trades (% of total) | 408 (47.83%) | Loss trades (% of total) | 445 (52.17%) | ||
| Largest | profit trade | 271.47 | loss trade | -279.73 | |
| Average | profit trade | 225.23 | loss trade | -212.31 | |
| Maximum | consecutive wins (profit in money) | 8 (1566.80) | consecutive losses (loss in money) | 7 (-1810.88) | |
| Maximal | consecutive profit (count of wins) | 1568.78 (6) | consecutive loss (count of losses) | -1810.88 (7) | |
| Average | consecutive wins | 2 | consecutive losses | 2 | |